Portal Analytics
When you click in to Reports from the main Approve Owl navigation, you land on the Portal Analytics page. An overview of page elements are as follows:
1. Quick stat modules
Section titled “1. Quick stat modules”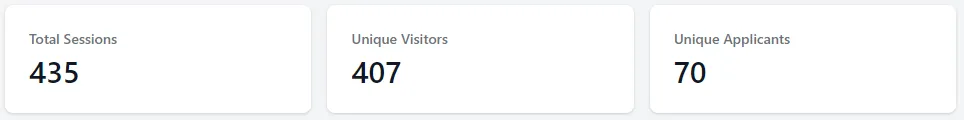
Total Sessions: Total number of visits to your Approve Owl site, including both new and repeat visits.
Unique Visitors: Visitors to your Approve Owl site, each visitor only counted once even if they visit repeatedly.
Unique Applicants: Your unique applicants count. Repeat applicants are only counted once.
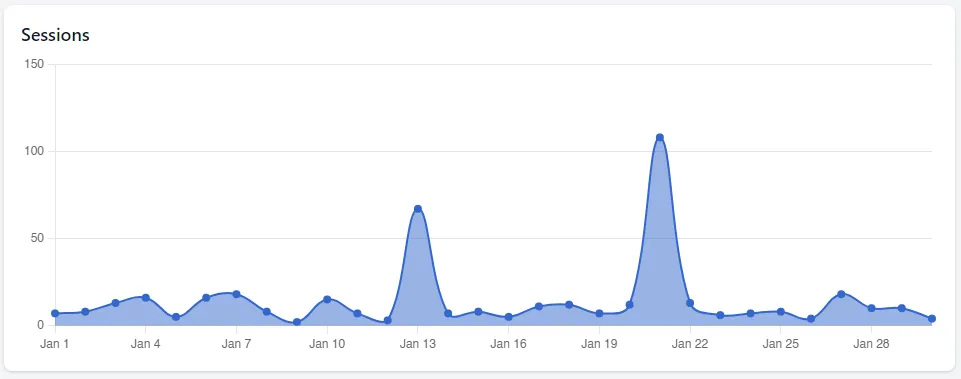
2. Sessions chart
Section titled “2. Sessions chart”Visual representation of Total Sessions activity over the timeframe you have chosen from the date range selector box at the top right of the page.
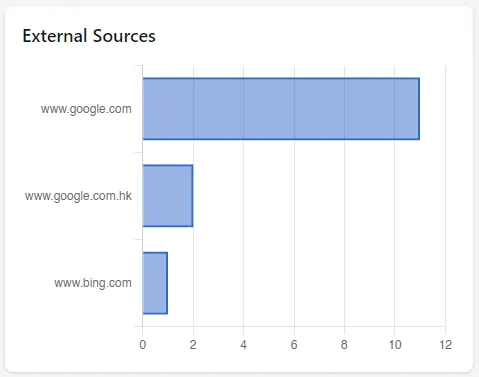
3. External sources chart
Section titled “3. External sources chart”Website that have driven customers to your Approve Owl, outside of direct linking.
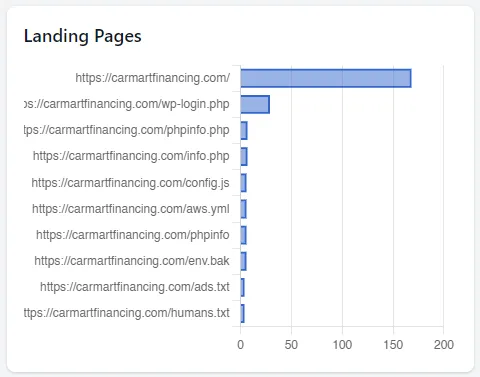
4. Landing Pages chart
Section titled “4. Landing Pages chart”The Approve Owl pages that customers first enter the site at.
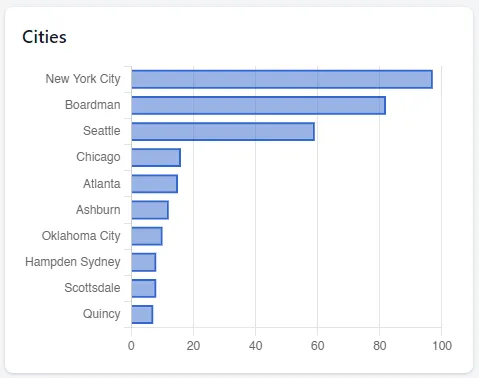
5. Cities chart
Section titled “5. Cities chart”Top ranking locations of visitors to your Approve Owl site.
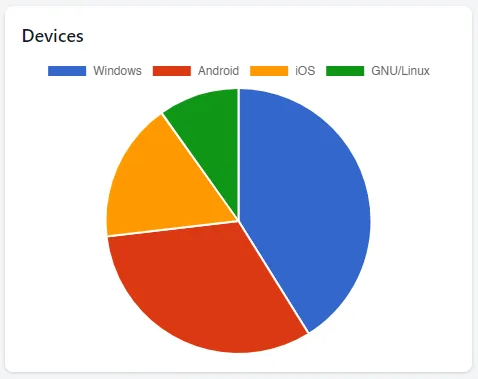
6. Devices chart
Section titled “6. Devices chart”The device types of customers that have visited your Approve Owl.